Vitaly Mogulian
Monte Carlo Variance Reduction Research & Code Developing & Nuclear Engineering
| Research Profile | BRAND Shielding Evaluations | GitHub |
Protvino concrete labyrinth benchmark (ALARM-CF-AIR-LAB-001)
A californium-252 neutron source of intensity $5.66 \cdot 10^8$ n/s is located at entrance to a 3-section concrete labyrinth [1]. The goal is computation of spatial distribution of a neutron flux linear functional which is determined via a fluence-to-energy response funtion and relates to the Bonner sphere detector count rates. Those are considered below just two of the most problematic cases among represented in the original work [1]: Case 5A (2 polyethylene plates in the 2nd section) and Case 6B (covered source and dead-end).
In this calculation, the following techniques are used:
- Expected value estimators;
- Simplified adaptive splitting.
The primary computational gain is achieved here thanks to the simplified adaptive splitting technique.
Computed flux functional - pulse rate by the detector response function is taken from the benchmark data for the case of 5 in. Bonner polyethylene sphere diameter.
 |
|---|
| Figure 1: Horizontal cross-section of Case 5A model |
 |
|---|
| Figure 2: Horizontal cross-section of Case 6B model |
Thicknesses of volumetric detectors are equal to 10 cm. Results of the two 11.2 hours long concurrently ran computations are presented in Figures 3-5 (see details in [2]).
 |
|---|
| Figure 3: Global plot of count rates spatial distribution for Case 5A, pulse/sec |
 |
|---|
| Figure 4: Local plot of count rates spatial distribution for Case 5A, pulse/sec |
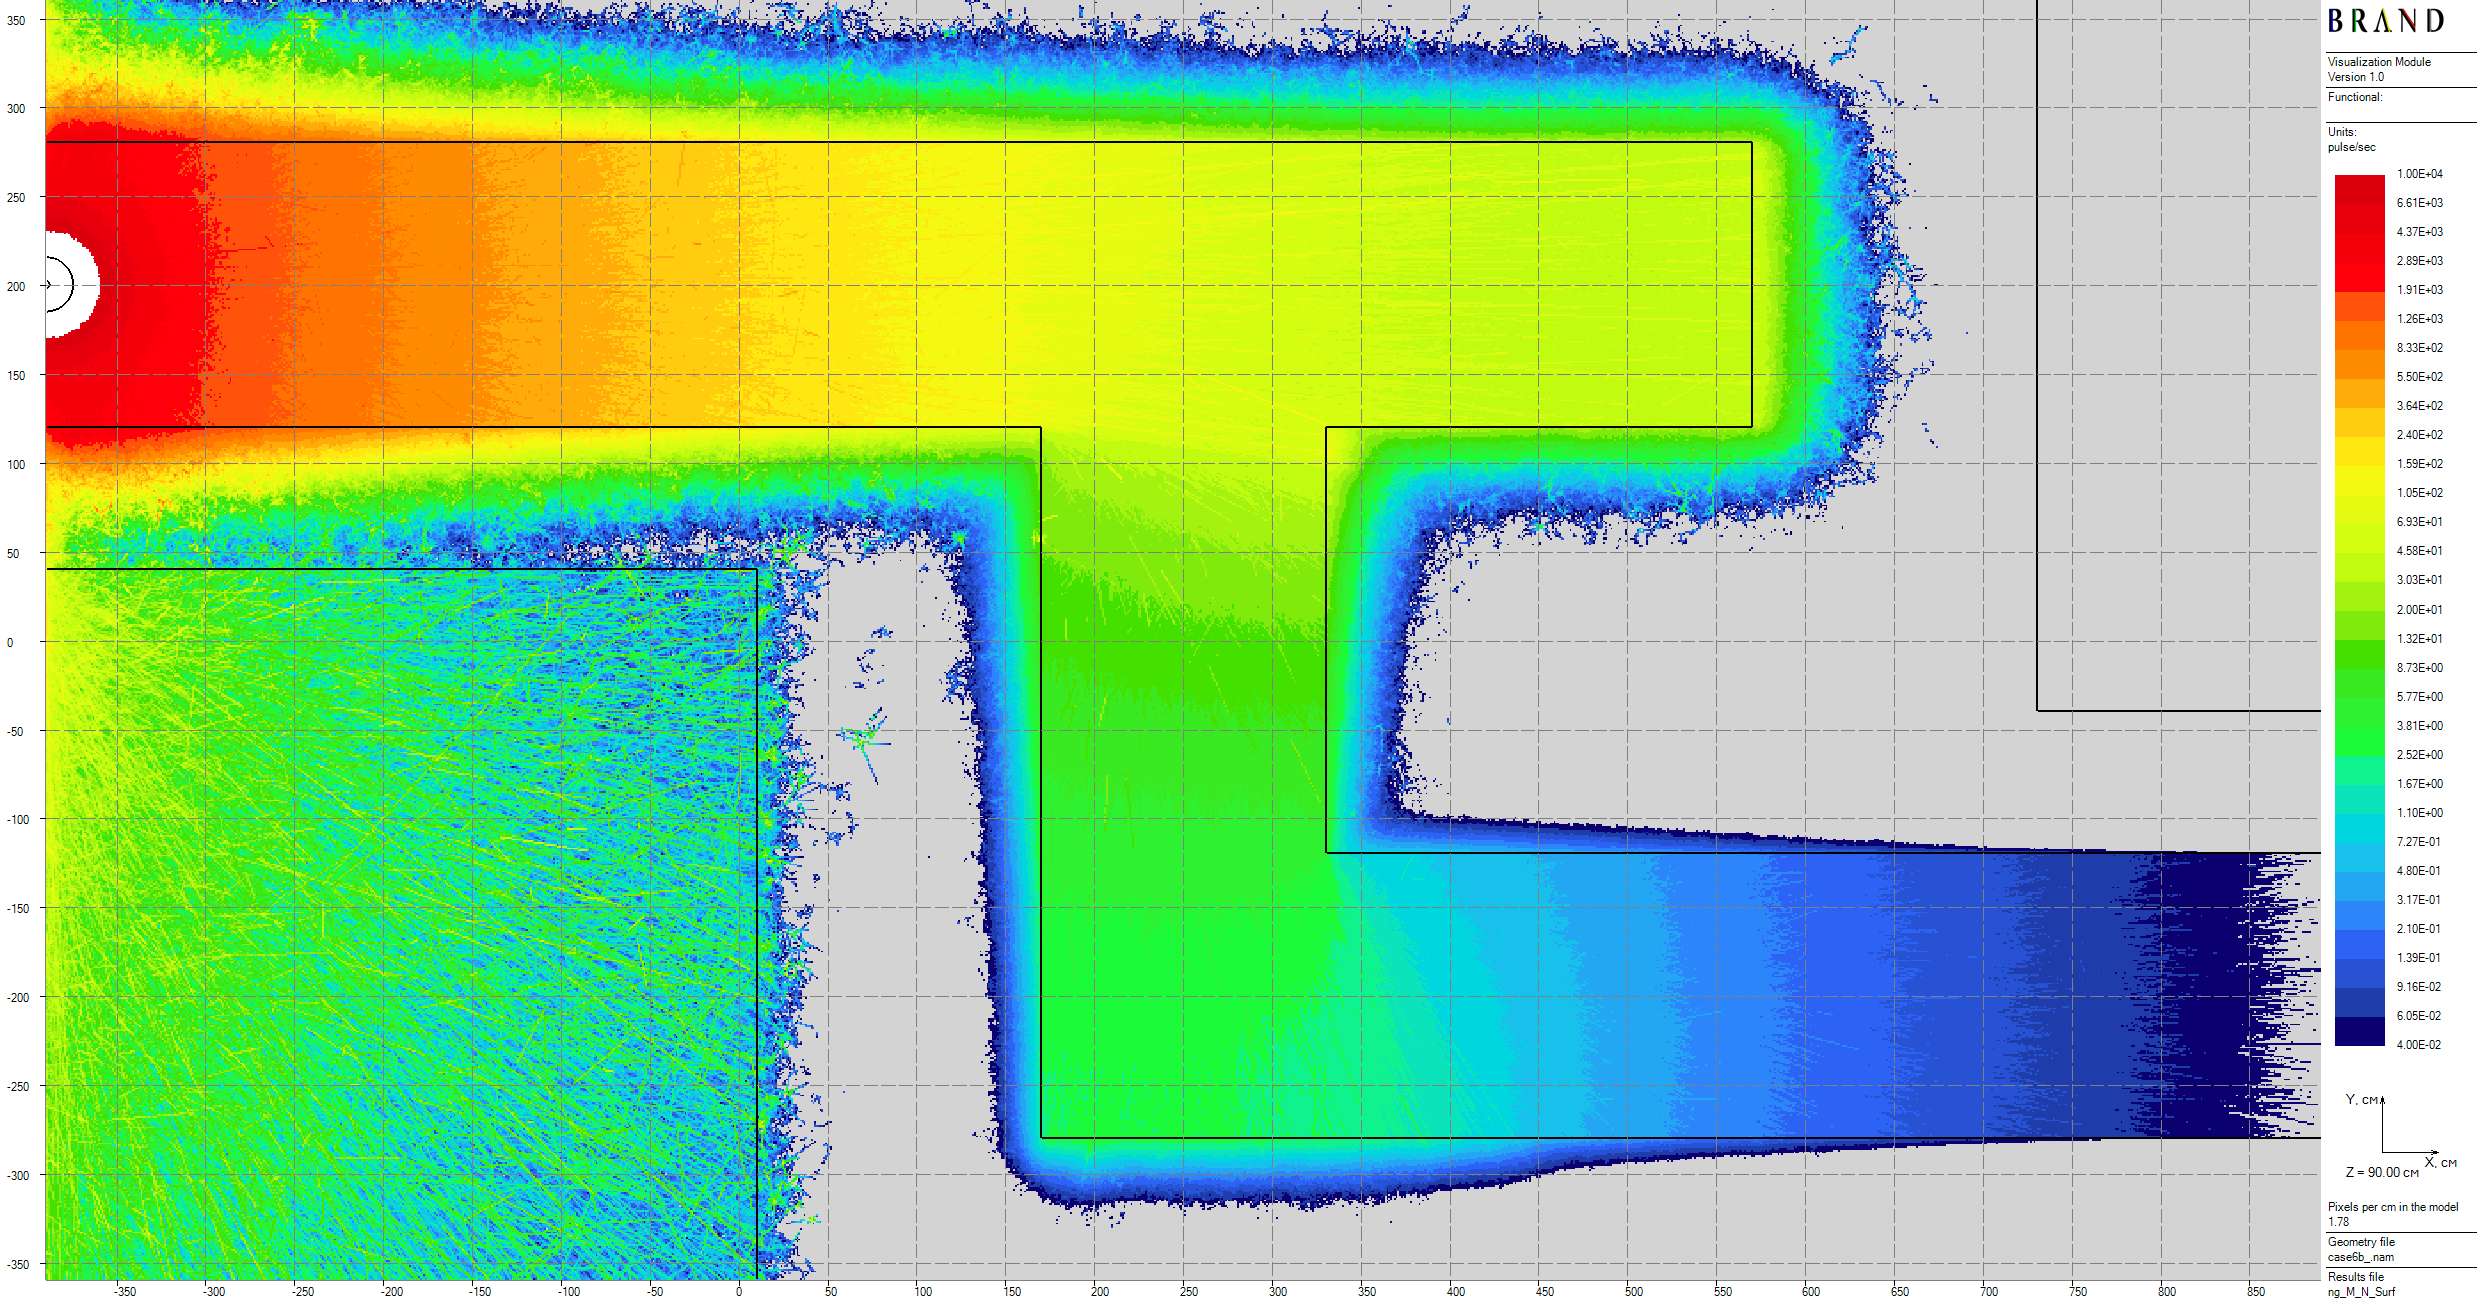 |
|---|
| Figure 4: Plot of count rates spatial distribution for Case 6B, pulse/sec |
References
- Mark Nikolaev, Natalia Prokhorova, Tatiana Ivanova, “Neutron Fields in Three-Section Concrete Labyrinth from Cf-252 Source,” ALARM-CF-AIR-LAB-001, “International Handbook of Evaluated Criticality Safety Benchmark Experiments,” OECD Nuclear Energy Agency, NEA-1486/19, 2021 (DVD).
- V.G. Mogulian. An approach to radiation shielding evaluations using estimators by expected scoring. 2025. doi:10.5281/zenodo.16781416.
Copyright © 2025-2026 Vitaly Mogulian. All rights reserved. Disclaimer.